
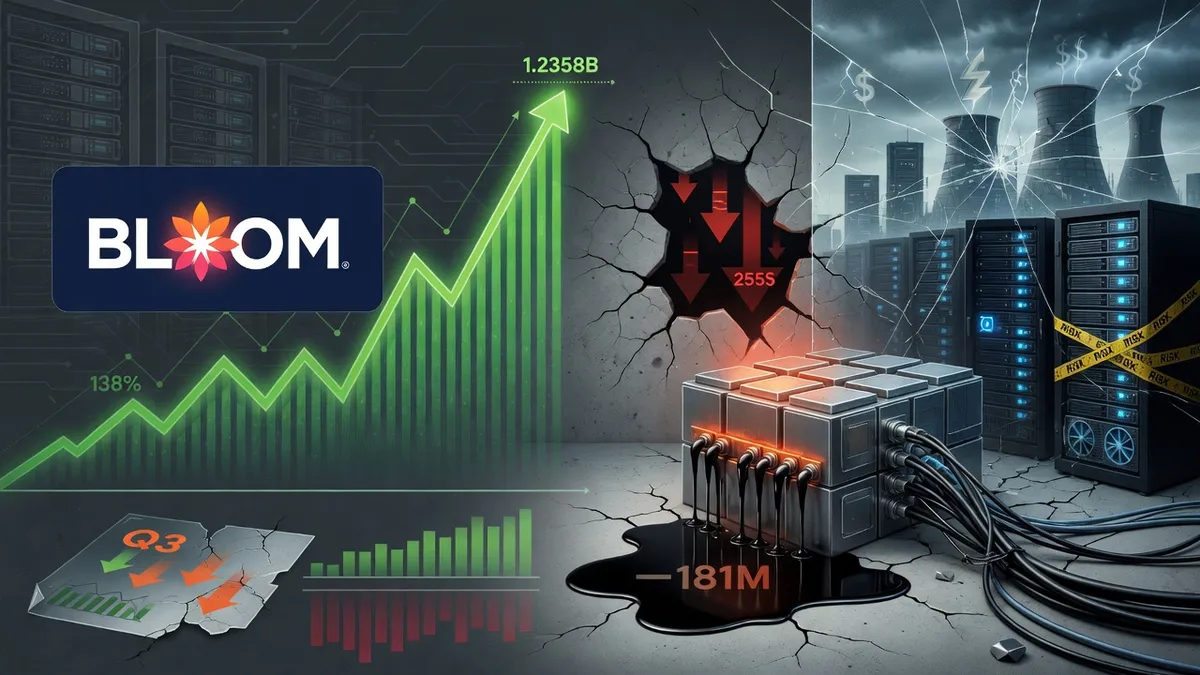
The article analyzes Bloom Energy’s third-quarter financial results: revenue rose 138% to $1.2358 billion, yet free cash flow turned negative by $181 million. It discusses implications for risk assessment of AI data-center energy infrastructure.
When the Market Stops Buying Growth Alone
On the evening of October 22, Bloom Energy released results that in a normal corporate reporting cycle would have been an unquestionable reason for optimism. Third-quarter revenue reached $1.2358 billion, up 138.1% year over year. GAAP operating profit was $225.4 million versus $7.8 million a year earlier. Adjusted earnings per share rose to $0.94. The company raised its full-year revenue guidance to the range of $4.4–4.6 billion. Yet the market reaction was substantially less favorable than the report’s dynamics: on October 23 the shares came under noticeable pressure. Negative free cash flow, capital expenditures, and the price of already-priced-in future growth moved to the center of attention.
This story matters not only to Bloom shareholders. It shows the transition to the next stage of the artificial-intelligence investment cycle. Until recently the market had mainly priced in the shortage of compute capacity, accelerators, and data centers. Now a second question arises: how much capital is required to supply those capacities with electricity, and what share of the economic benefit will go to equipment makers rather than their clients. Strong demand does not remove the need to finance production, inventory, and service obligations.
Report Facts: Profit Is Already There, Free Cash Is Still Scarcer
In the report published on October 22 for Bloom Energy’s third quarter, revenue is stated at $1,235.8 million versus $519.0 million a year earlier. Product sales rose 179.4% to $1,073.6 million. GAAP gross margin increased from 29.2% to 33.8%, operating margin from 1.5% to 18.2%. These figures confirm not only turnover expansion but also efficiency gains at the income-statement level. Adjusted EBITDA came in at approximately $299.5 million. An important distinction: EBITDA, net income, and free cash flow describe different economic phenomena.
According to the quarterly publications, operating cash flow was negative by roughly $27 million and free cash flow was approximately minus $181 million. This does not contradict high accounting profit: a growing manufacturer must pay for materials, expand capacity, and finance the gap between component purchases and cash collection from buyers. For assessing business sustainability it is important to determine how much of the negative flow is tied to temporary working capital and how much to the permanent capital intensity of the model. One quarter does not give a final answer but requires careful analysis.
From Accelerator to Power Plant: Where AI’s Bottleneck Now Lies
A compute center cannot be brought online with graphics-processor deliveries alone. It needs a site, substation, transformers, transmission lines, redundancy, cooling systems, and guaranteed electricity availability. If grid connection takes years, the cost of waiting becomes an independent line item in the investment budget. Therefore distributed generation offered by Bloom is interesting not as an abstract green technology but as a potential tool to shorten the time to commercial operation of a data center.
Installing a power source directly at the consumer’s site can reduce a project’s dependence on external-grid upgrade timelines. Yet this is not a cost-free substitute for grid infrastructure. Fuel deliveries, maintenance, permits, redundancy, and verification of the total cost per megawatt-hour are required. If gas prices rise, the economics of individual solutions change. If the grid operator accelerates connections, part of the price premium for autonomy disappears. Therefore the market for distributed-generation equipment depends simultaneously on the pace of data-center construction and on the quality of traditional energy infrastructure.
What Bloom Exactly Sells and Why It Matters for Valuation
Bloom Energy manufactures solid-oxide fuel-cell systems that convert the chemical energy of fuel into electricity without the traditional combustion process in a turbine. The commercial offering is built around the ability to obtain reliable on-site power for the customer. For analyzing the financial model it is not enough to compare the company with a classic solar-panel maker or a software developer. Its revenue includes equipment, and project economics involve installation, service, fuel, warranty terms, and long-term operation.
At a high order pace, requirements for manufacturing discipline increase. A delay in a single component can shift delivery of an expensive system. A contract may stipulate staged payments, while cash for materials leaves the supplier before final settlement is received from the client. Therefore the rate at which profit converts into cash flow becomes as important as gross margin. A long-term service contract can support revenue predictability but simultaneously creates obligations for repairs and module replacements that must be factored into the calculation of real profitability.
The Paradox of 34-Percent Margin
Bloom management guides investors to an adjusted gross margin of around 34% for 2026. For a manufacturing company this is a substantial figure, yet it cannot be compared directly with the margin of software developers. First, capital expenditures for capacity expansion pass through cash flow and the balance sheet, not entirely through current-period gross profit. Second, non-GAAP adjustments exclude certain expenses that may have economic significance for shareholders. Third, scaling production can temporarily raise the share of logistics, quality-control, and warranty costs.
The key question is the sustainability of the margin when moving from small series to large industrial batches. Volume growth should spread fixed costs across more units. But if the company is forced to accelerate its supply chain, it may pay suppliers a premium, hire more expensive personnel, and incur costs for starting new lines. Consequently, the 34% forecast is not automatic proof of future high free-cash-flow profitability. Confirmation requires several consecutive quarters of positive operating cash flow and controlled capital expenditures.
Scaling from One to Five Gigawatts: Manufacturing Risk
According to reports on the quarterly results, Bloom is developing a program to expand annual manufacturing capacity from roughly one to five gigawatts. Such a target radically changes the character of the business. The company stops being a supplier of a relatively limited number of complex systems and must build an industrial platform with repeatable quality, reliable material supplies, and standardized service. The investment thesis begins to depend not only on orders but also on the ability to fulfill them without losing control of unit costs.
A fivefold increase in potential capacity does not mean a fivefold rise in realized product. Between nominal plant output and paid delivery lie capacity-utilization rate, component availability, testing time, on-site installation, and the client’s readiness to accept the system. Under-utilization of a new line raises unit cost. Excessively rapid ramp-up increases the risk of defects and warranty expenses. This is where operating leverage works in two directions: with successful execution, profit grows faster than revenue; with failures, the same leverage amplifies losses.
Why the Share Decline Does Not Cancel the Quality of the Report
The capital market prices not only the fact but also the divergence between fact and expectations. When shares have already risen on expectations of accelerating demand, a strong quarter becomes a necessary condition for preserving the valuation rather than a new positive surprise. Publications on October 23 linked Bloom’s share-price decline to negative free cash flow and high investor expectations. This is an interpretation of the market reaction, not proof of the sole cause of the price move. Trading results are simultaneously influenced by fund positioning, liquidity, options, and the overall dynamics of the technology sector.
For an analyst another conclusion is more important. Even if operating profit has risen manyfold, investors may lower the permissible multiple once they understand that expanding the business will require more external or internal capital. The longer the path from order to cash receipt, the higher the sensitivity of fair value to the discount rate. Therefore the raising of revenue guidance and the share-price decline do not form a logical contradiction. They reflect different sides of one model.
Who Benefits from Data-Center Energy Shortage
The first circle of potential beneficiaries consists of suppliers of equipment for on-site generation. The second includes makers of transformers, switchgear, load-management systems, and industrial automation. The third covers contractors for construction and integration of energy facilities. The fourth is linked to fuel suppliers and delivery infrastructure. However, these groups do not receive equal profits. Equipment makers may enjoy high revenue but significant working-capital needs. Grid companies often have regulated returns. Contractor margins depend on material costs and delay risk.
Electricity buyers, including data-center operators, are also heterogeneous. A large hyperscaler can spread investments across multiple sites and power sources. A smaller operator is more dependent on the terms of a single contract and credit availability. If energy costs rise faster than compute revenue, capacity expansion may slow. Consequently, growth in AI demand does not guarantee proportional value growth for every participant in the energy chain.
Gas Dependence: New Link Between AI and Commodity Markets
Distributed-generation systems can run on various fuels, yet the economics of many projects depend on natural-gas availability. Against this background the 2026 energy crisis acquires additional significance. International LNG supply disruptions and high demand for reliable electricity can increase the value of autonomous energy sources while simultaneously raising their operating cost. The paradox is that the same electricity shortage helps the equipment seller and worsens the buyer’s economics.
An investor must assess not only capital expenditure per megawatt but also the present value of energy over the project life cycle. The calculation includes fuel cost, utilization factor, maintenance, module life, cost of capital, and possible emission payments. In regions with cheap gas, on-site generation can be more competitive. Where fuel is expensive and the grid is reliable, the advantage depends on the value of faster connection and the cost of downtime.
Cash Flow as a Test of Demand Quality
The most important next indicator for Bloom is not another revenue record by itself but the dynamics of operating cash flow relative to operating profit. If growth in receivables and inventory outpaces sales, the company is effectively financing part of its clients’ expansion from its own balance sheet. This is acceptable during a scaling phase but cannot continue indefinitely without an increase in financing cost. Capital expenditures and the payback period of new production lines should also be monitored separately.
A useful analytical test consists of three sequential observations. First, conversion of order into recognized revenue is checked. Next, conversion of revenue into operating cash flow is evaluated. Finally, the balance after capital expenditures is calculated. Only the last figure shows how much cash the business generates for debt repayment, liquidity accumulation, or return of capital to shareholders. For a fast-growing company, a temporarily negative figure is not a verdict but requires a demonstrable plan for normalization.
Stock Valuation: When the Multiple Becomes Part of the Risk
In companies with sharp revenue acceleration, the traditional price-to-current-earnings ratio often describes future value poorly. Replacing it with price-to-forecast-revenue does not solve the problem. A high multiple assumes that a significant part of future growth will already be realized and that margins will remain sustainable. A modest reduction in expected profitability or the postponement of several large projects by one quarter can lead to a substantial revision of fair value.
For valuing Bloom it is useful to build several discounted-cash-flow scenarios, separately modeling capacity utilization, gross margin, capital expenditures, and working capital. At a high discount rate, distant cash flows are worth noticeably less. If financing remains expensive, even excellent product demand does not guarantee attractive equity returns. The reverse situation is possible with accelerated release of working capital and a faster transition to positive free cash flow. Without the current market price and a complete model, it is impossible to name a specific target price in good faith.
Base Scenario for the Next Two–Three Quarters
The base scenario assumes continued growth in shipments and gradual absorption of production investments. Management reaffirmed the annual revenue target of $4.4–4.6 billion and adjusted gross margin of around 34%. Within this scenario, part of the negative cash flow reflects temporary inventory build-up and the commissioning of new capacity. Positive confirmation would be stable order-execution timelines, absence of a sharp deterioration in gross margin, and a narrowing gap between accounting profit and cash receipts.
The scenario requires revision if inventory and receivable growth persists without comparable acceleration in cash collections, if revenue guidance is lowered, or if production expansion is accompanied by substantial warranty costs. The cost of natural gas for customers remains a separate factor: its rise can worsen the economics of new projects. The base scenario does not assume linear share-price growth, because stock valuation depends on market expectations and the cost of capital.
Positive Scenario Through Mid-2027
The positive variant rests on the assumption that the shortage of available electrical capacity for data centers proves persistent and Bloom expands production without noticeable deterioration in quality or cost. Then high demand translates into paid deliveries, and improvement in operating leverage allows faster normalization of free cash flow. A reduction in the share of advance-funded materials in turnover and faster settlements with clients can provide additional effect without requiring proportional revenue growth.
Confirmation criteria will be repeatable positive conversion of operating profit into cash flow, on-time delivery of large projects, margin preservation amid rising output, and moderate need for external financing. The scenario is canceled by significant delays in commissioning new lines, systemic quality problems, or cuts in data-center operators’ investment budgets. Even with favorable business development, a shareholder must factor in the risk of an initially inflated valuation.
Negative Scenario: Orders Exist, Cash Does Not
A negative trajectory does not necessarily begin with falling demand. It is enough that deliveries require ever-larger advances to suppliers while clients postpone site-commissioning dates. In that case the company may show growth in the order backlog and reported revenue yet finance expansion from its own balance sheet or new capital. At high interest rates the cost of this financing quickly becomes material. An increase in the number of shares dilutes existing shareholders, and growth in debt burden limits financial flexibility.
Early signals include persistently negative free cash flow without a clear link to the investment schedule, declining gross margin, rising overdue receivables, and worsening contract terms. Criterion for canceling the negative scenario: restoration of cash conversion while maintaining high volumes of paid deliveries and no need to raise capital on unfavorable terms.
What to Watch in Subsequent Publications
In the next report, revenue dynamics should be compared with operating-cash-flow growth; movements in inventory and receivables should be examined separately; and changes in capital expenditures should be checked. It is important to determine which expenses relate to one-time production expansion and which will become permanent. The order backlog is useful only together with information on execution timelines, the client’s right to reschedule deliveries, and the structure of advance payments.
It is also necessary to monitor the pace of data-center grid connections, gas prices in key regions, development of alternative electricity sources, and financing terms for large infrastructure projects. Corporate presentations especially require clarification of the methodology for calculating non-GAAP metrics. Comparing quarters without accounting for changes in adjustments can create an illusion of accelerating efficiency where part of the expenses has simply been excluded from the chosen metric.
Main Conclusion: Electricity Has Become an Asset, but Capital Remains the Constraint
Bloom Energy demonstrated a rare combination of large-scale revenue growth and improved operating profitability. This is a confirmed corporate fact. At the same time, negative free cash flow shows that converting demand for energy equipment into cash for shareholders requires time, investment, and precise execution. A strong report does not eliminate investment risk, especially if the share price already priced in multi-year growth.
For the entire artificial-intelligence infrastructure, this story becomes a useful reference point. The next wave of competition will unfold not only for chips and servers but also for reliable megawatts, available sites, transformers, service capacity, and capital. The financial winner will not necessarily be the company with the loudest order growth. The advantage will go to the business that can translate demand into sustainable margins, controlled investments, and free cash flow.
Sources
Article prepared by the analytical department of TradePass