
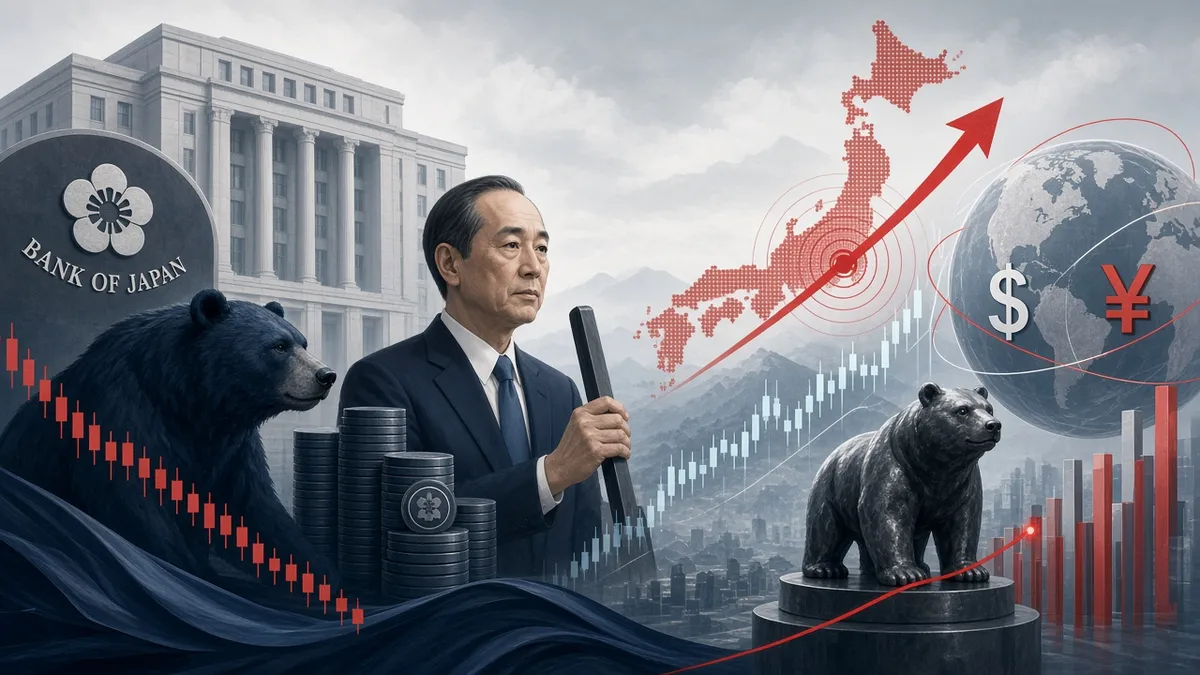
The article analyzes the Bank of Japan's decision to keep the rate around 1.25% and accelerate ETF sales to 860 billion yen per year starting January 2027, as well as assesses the implications for USD/JPY and Japanese stocks.
Japan took a step that cannot be assessed from the headline about the rate alone. On October 30, 2026, the Bank of Japan kept the short-term target around 1.25%, but announced an increase in the annual pace of exchange-traded fund sales from 330 to 860 billion yen in book value starting January 2027. At the same time, one board member already called for raising the rate to 1.50%. For the international investor, this combination means that the country continues normalization simultaneously through the price of money and through the structure of demand in the stock market.
The yen has for decades played the role of a cheap funding currency, Japanese government bonds were a symbol of ultra-low yields, and the central bank was a significant ETF holder. Now all three familiar constructs are gradually changing. This is not a promise of a collapse in Japanese stocks and not a guaranteed signal for JPY strengthening. It is a transition to a market where the cost of risk is increasingly less determined by the constant presence of an official buyer.
Decision eight to one: the dispute is already about speed
The Bank of Japan kept the overnight call rate target at around 1.25% by a vote of eight board members against one. Hajime Takata proposed 1.50%, citing the achievement of the 2% target by core inflation and the need to approach the neutral rate faster. His proposal was rejected. However, the disagreement itself is significant: the discussion is shifting from whether normalization is needed at all to how quickly monetary support should be curtailed.
The regulator in the October materials indicates that core inflation is already at a level broadly consistent with the 2% target, and long-term inflation expectations are around 2%. For an economy that long existed in conditions of weak price growth, this is a historic regime change. But the caveat matters: inflation driven by imported energy and inflation backed by sustained wage growth require different responses. The former reduces purchasing power, the latter may signal a healthier domestic cycle.
Raising rates too quickly is dangerous for households and borrowers. Delaying normalization is dangerous if inflationary expectations become entrenched. Therefore, the Bank of Japan is not obliged to act automatically after every strong price reading. For the currency market, what matters more is which data will make the majority of the board join the dissenting member's arguments than the mere existence of one vote for a hike.
Forecasts point to a narrow margin for error
The official October forecast projects real GDP growth of 0.7% in fiscal 2026, 0.7% in 2027, and 0.8% in 2028. The forecast for inflation excluding fresh food is 2.5%, 2.6%, and 2.0%, respectively. For the measure excluding fresh food and energy the figures are 2.4%, 2.7%, and 2.3%. These are median forecasts of board members, not published results for future periods.
The forecast for fiscal 2027 was revised upward: by 0.2 percentage points for inflation excluding fresh food and by 0.1 points for the measure excluding fresh food and energy. At the same time, expected GDP growth in 2027 was lowered by 0.1 points relative to the July assessment. Such a combination reminds of the problem: prices can remain elevated even when economic activity is not strong enough for a painless increase in the cost of credit.
Here one cannot automatically treat higher inflation as a boon for banks or a higher rate as a boon for the currency. If wages lag prices, real household spending may weaken. If companies cannot pass on higher energy costs to buyers, operating margins fall. If wages and productivity grow in tandem, a moderate rate hike can accompany healthy normalization without a serious downturn.
860 billion yen: the figure that is easy to misread
The ETF decision deserves separate arithmetic. The previous sales pace was around 330 billion yen per year in book value; the new one is around 860 billion. The roughly 2.61-fold increase is striking, but it does not mean selling the entire portfolio and does not allow multiplying any potential index decline by the same coefficient. The Bank of Japan estimates the new volume at about 0.1% of market turnover versus the previous 0.05%.
Even more important is to distinguish book value from market value. According to the regulator's own estimate, 860 billion yen of annual sales in book value equates to approximately 2.46 trillion yen in market value using its conversion factor. These are not two different proposals. It is one program presented in different units of measurement. An error at this point can distort any calculation of supposed market pressure.
In the official comparison, the previous pace would have taken roughly 112 years to complete, while the new pace takes about 43 years. The time scale explains why the program is more likely to alter the long-term ownership structure of equities than to create an immediate flow of forced liquidation. At the same time, the regulator retained the right to adjust or temporarily suspend sales if market conditions change. Actual supply may deviate from a straight linear path.
How a technical seller affects fundamental price
An ETF represents a basket of stocks, so its sale does not mean the regulator has formed a negative view of any particular issuer's earnings. It means a change in the structure of flows. With stable demand from private investors, the market can absorb the supply without a meaningful price change. With simultaneous cuts in foreign investment and deteriorating liquidity, the same flow can amplify volatility.
The Nikkei 225 and TOPIX indices have different methodologies, company weights, and sector structures. One cannot claim that the new program will automatically hit both equally. The Bank of Japan intends to sell ETFs roughly in proportion to their shares in its portfolio, spreading operations over time. Therefore, analysis should rest on the structure of actual funds, market turnover, and the composition of buyers, not solely on the program's headline nominal size.
The stock market remains a function of three variables: expected earnings, the discount rate, and capital flows. An exporter can increase yen-denominated earnings because of a weak currency but receive a lower multiple when bond yields rise. A bank can expand its net interest margin but suffer losses from the revaluation of fixed-income securities. Both cases illustrate why an index rise or fall is not a direct consequence of a single figure from the press release.
USD/JPY and the new price of carry trade
For the currency market the differential in expected rates matters. After the October FOMC decision the federal funds range stands at 3.75–4.00%, while the Bank of Japan's target is 1.25%. The operational rates of the two central banks are not fully identical, yet the nominal gap remains substantial. This explains why yen-funded strategies continue to attract attention. However, the profitability of carry trades cannot be assessed by subtracting the two official percentages alone.
Currency returns include spot movement, forward points, hedging costs, financing fees, and leverage effects. If an investor borrows yen to buy a dollar asset, a sharp strengthening of JPY can wipe out a large part of the annual interest advantage within days. With high leverage, losses can trigger margin calls, forced position reduction, and further yen appreciation.
Suppose, in an illustrative calculation, that an investor expects several percentage points of positive annual carry, but the yen strengthens 5% in a short period. Even without fees, the currency effect can outweigh the interest income. This is not a forecast of exchange-rate movement and not a description of any specific trade. It is a way to illustrate asymmetry: income from the rate differential accrues gradually, while currency risk materializes instantly.
Raising the Japanese rate itself to 1.50% does not guarantee yen appreciation. If the market has already fully priced in such a move, the reaction may be muted. If U.S. bond yields rise faster than Japanese yields at the same time, the relative advantage of the dollar persists. Conversely, a deterioration in the U.S. outlook can support the yen even with another Japanese pause. Therefore, one must watch changes in expectations, not a single absolute rate.
The real rate matters more than a symbolic victory over deflation
Nominal 1.25% says nothing about policy tightness without comparison to inflation expectations. If expected inflation is around 2%, the short-term real rate by a simple approximate measure remains negative. But such a comparison requires caution: expectations and nominal rates must refer to comparable horizons. For market assessment, real yields, wage dynamics, and business surveys are useful, not arithmetic from non-simultaneous indicators.
With sustained wage and productivity gains, the economy can withstand a higher cost of money. With predominantly imported inflation, households face shrinking real income, and further tightening can deepen a downturn. Therefore, the core question for the Bank of Japan is not reduced to formally reaching 2%. What matters is the economy's ability to sustain that level without a constant external price shock.
JGB: interest-rate risk returns to the market
On the Japanese government bond market, rate expectations, inflation premia, fiscal factors, and demand from banks, insurers, and pension funds operate simultaneously. Short-term instruments are most sensitive to near-term central-bank decisions. Longer maturities also depend on term premia and the liability structures of institutional investors. There is no rule that the entire JGB curve must move uniformly.
Modified duration shows price sensitivity to yield. A hypothetical bond with ten-year duration loses approximately 2.5% in price when yields rise 25 basis points, before convexity. This is an illustrative calculation, not current yield or a forecast for any specific issue. It reminds that small rate changes become noticeable for long-term portfolios, especially after decades of ultra-low yields.
Higher JGB yields could potentially increase the attractiveness of domestic assets for Japanese institutional investors. But repatriation of foreign capital does not occur automatically. Decisions depend on hedging costs, regulatory constraints, liability schedules, and already built portfolios. The sweeping assumption of mass capital return to Japan without flow data can be as erroneous as ignoring the channel altogether.
Who benefits and who loses from higher rates
Banks can gain from higher yields on new loans and reinvested assets if deposit costs rise more slowly. Yet sizable fixed-income portfolios can simultaneously lose value. Credit losses also do not stay constant: borrowers with floating-rate debt and weak cash flow are sensitive to higher financing costs. Therefore, for banks one must analyze net interest margin, credit risk, and capital sensitivity to rates together.
Insurance companies obtain higher yields on new funds, which helps cover long-term liabilities. But market revaluation of older holdings and changes in currency hedges can worsen short-term results. For real estate the situation is even more complex: rental yields and refinancing costs change at different speeds. Incidentally, the pace of J-REIT sales by the central bank remains around 5 billion yen per year in book value, so it does not repeat the ETF program's acceleration.
For exporters a weak yen increases the translation of overseas revenue into the domestic currency, but the benefit depends on production localization, procurement currency, and hedging policy. For domestically oriented companies yen strengthening can cheapen imports, although higher rates can restrain lending. For technology producers an additional factor is the global investment cycle, including demand for AI equipment. There is no uniform sign of reaction across all Japanese stocks.
Scenarios for the next nine months
Gradual normalization, horizon one to three months. Inflation stays close to the projected path, wages rise moderately, and the Bank of Japan does not rush into a series of hikes. USD/JPY reacts mainly to U.S. data and shifts in the yield differential. The ETF program remains a known future factor but does not create persistent liquidity shortages. Cancellation criterion: sharp acceleration in core inflation or sudden weakening of domestic demand.
Accelerated tightening, horizon three to six months. Wage dynamics, services inflation, and corporate expectations confirm persistent price pressure. The Bank of Japan raises rates faster than market participants expected. The front end of the JGB curve is repriced, the attractiveness of yen funding declines, and exporters face currency-appreciation risk. Cancellation criterion: sustained slowdown in core inflation and lack of pass-through from prices to wages.
Global carry stress, horizon six to nine months. A decline in global risk appetite triggers simultaneous unwinding of yen-funded positions. The yen strengthens regardless of the regulator's cautious rhetoric, Japanese equities come under pressure, and volatility rises. The Bank of Japan may use the flexibility built into the ETF program. Cancellation criterion: restoration of market liquidity, lower currency volatility, and absence of forced deleveraging.
This is not a probabilistic model and not a promise of specific exchange rates. Scenarios are needed to identify observable signs in advance and then avoid replacing changed data with an old conviction. For each instrument it is important to know which factor is leading: relative rates, technical flows, issuer earnings, or global sentiment.
Checkpoints for the professional investor
For USD/JPY one must compare two-year U.S. and Japanese yields, currency-option dynamics, and hedging costs. For JGBs watch auctions, demand from long-term investors, and changes in curve slope. For Japanese equities track the spread between Nikkei 225 and TOPIX, foreign-investor flows, exporter and bank earnings reports. For assessing the ETF program, actual execution volumes after January 2027 are useful, not only its announced nominal size.
The calendar must also be considered: U.S. macro data, FOMC decisions, Japanese wage figures, and corporate reports are released at different times. Therefore, yen movement after a Japanese meeting can be driven by later U.S. news. Attributing the entire reaction to the Bank of Japan means misidentifying the source of risk and building a position on that error.
Conclusion: normalization now has a price
The October 30 decision left the rate at 1.25% but confirmed that the previous regime of support for the Japanese market is gradually receding. One board member is already calling for a higher rate, forecasts point to sustained core inflation, and ETF sales are more than doubling. It is important not to confuse a slow program spanning decades with an immediate sell-off and not to turn anticipation of the next hike into an unconditional bet on yen appreciation.
For the currency trader the main risk lies in carry asymmetry. For the Japanese-bond holder it lies in the return of rate sensitivity. For the equity holder it lies in the divergence between fundamental earnings and capital flows. Anyone who separates these channels and monitors scenario-cancellation criteria obtains a more reliable analytical map than an investor who sees only the word “pause” in the decision.
Sources
Article prepared by TradePass analyst: Boris Katz